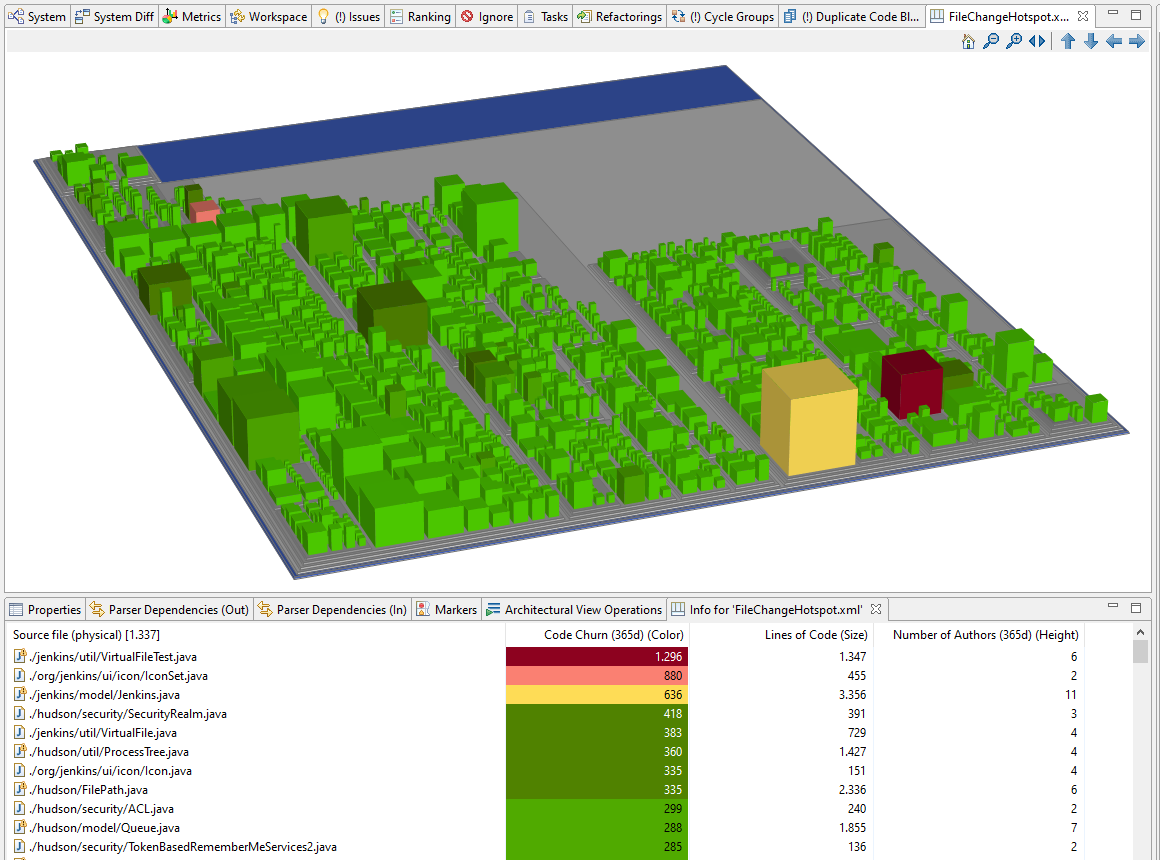
Treemaps are great for visually spotting hotspots, but if you want to actually work with the information, a tabular representation is better. The 'Treemap Info' view can be opened via the context menu and displays information about the treemap's leaf elements as shown in the following screenshot:
The table supports the usual interactions like sorting, filtering, export to Excel, etc..
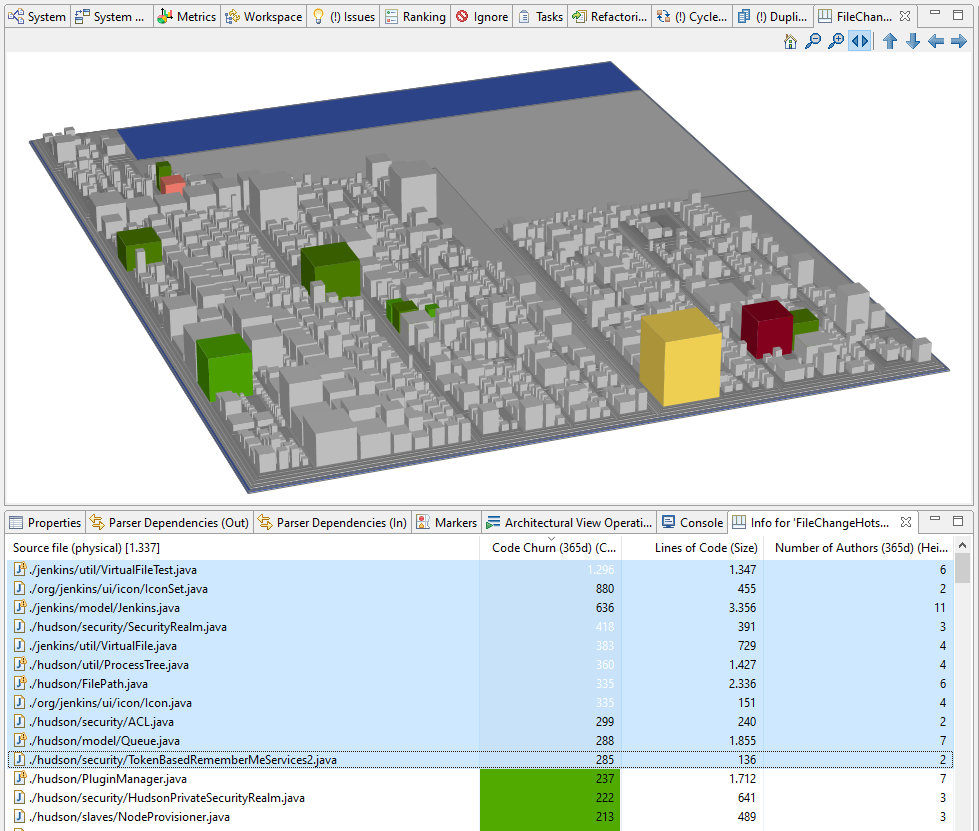
Selecting elements in the 'Treemap Info' view highlights those elements in the treemap by greying all other elements:


