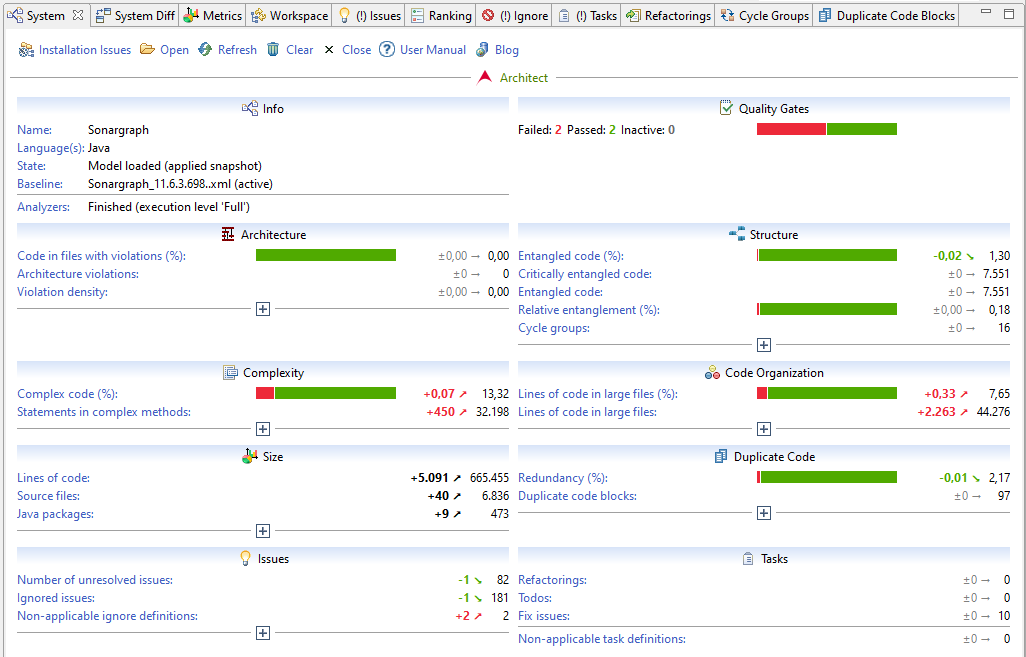
In version 12 we release a reworked "System" view. There are boxes for different quality aspects, like "Structure", "Complexity" and "Code Organization". Each box contains a few key metrics, with the option to expand the box via the "+"-icon to see more details. A couple of new metrics like "Entanglement (%)" have been introduced, so that it is now easy to see how much of the code base is affected by a certain type of issue, e.g. "cycle groups". These percentages also indicate the probability that a developer is affected by the problem if she looks at any line of code. These values are easier to interpret than a rather abstract numeric metric value like "Average Component Dependency".
If a baseline report has been applied, metric trends are shown. This makes it very easy to spot where the quality of the code base needs more attention.