Sonargraph offers views to support several use cases related to issues:
-
Get an overview of all issues: The Issues view shows all detected issues, offers advanced filter options and aggregates issue counts into the physical structure (system, modules, roots, files), so that hotspots can be detected easily.
-
Get a prioritized list of issues related to the source code (i.e. no issues related to the Sonargraph system are shown): The Ranking view shows the computed score for each issue. The score is based on the issue's urgency and importance. See section Section 9.2.1, “ Identifying the Most Relevant Issues to Fix ” for details.
-
Get a list of ignored issues: Some detected issue might not be are relevant, e.g. a method violates consists of more lines than the defined threshold but splitting it up would make the algorithm more difficult to understand. Those issues can be ignored (i.e. they are no longer shown in the Issues view) and the Ignore view list all these ignore definitions.
-
Get a list of defined tasks: Tasks can be defined for issues that must be fixed, including implementation suggestions for the developer. The issues are also no longer shown in the Issues view and the tasks can be tracked in the Tasks view.
The Issues view displays information about the found issues such as their severity, category, affected elements and the associated provider. The upper half of the view displays the affected elements in a tree, following the file structure of the code and the Sonargraph system files. The information about the number of affected elements, and numbers of issues of error, warning and info severity is aggregated for each element and its children, making it easier to identify hotspots, i.e. modules with a high number of detected issues. The list of issues is shown in the lower part for the selected elements and their children. If you want to see all issues of the system, either click on the white space below the tree or select the System and Installation root nodes. If you are only interested in issues for specific modules, select them in the tree and only issues related to code in those modules are shown in the table.
The presentation mode (flat, hierarchical, mixed) of the elements tree can be switched via the view options menu in the top-right corner.
NOTE
The numbers of issues and affected elements on a parent node are not necessarily the sums of the values of its children. This is caused on the one hand by "composite" issues, e.g. "Duplicate Code Block" and "Cycle Group" that affect several elements, but are only counted once for common parents of the affected elements. And on the other hand, the parent element itself might also be involved in issues.
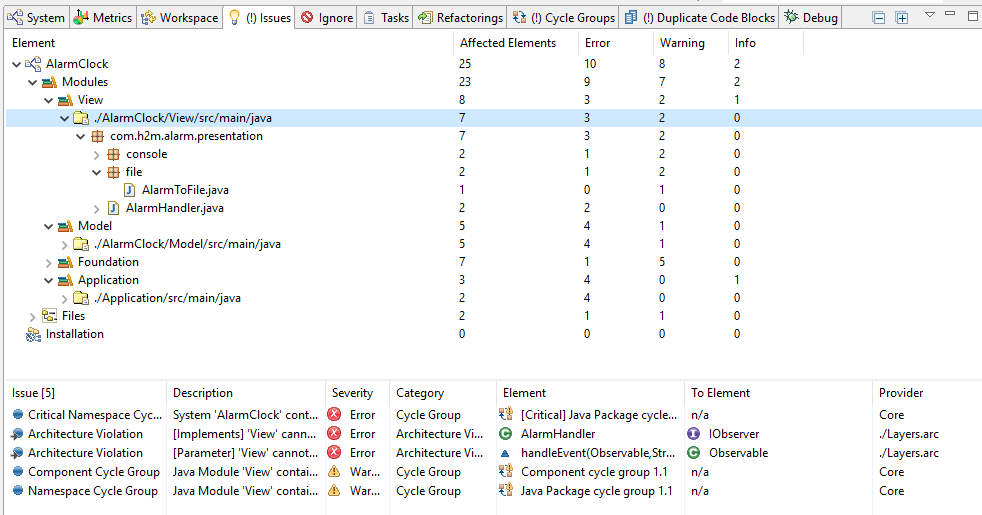
Context menu and double click interactions give you options to examine the issue in a more suitable view. They also allow to "ignore" or "fix" the issue by either ignoring it or creating a fix request for someone in the development team. These requests are called "Resolutions" in Sonargraph and are covered in depth in the following sections.
In case of having too many issues, you can apply filters using the "Filter..." view option on the upper-right corner where several criteria are offered to reduce the amount of visible issues:
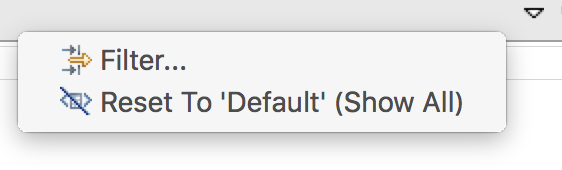
A filtered view is indicated by a yellow background.
TIP
A text filter can also be applied to the table displaying the issues. See Section 8.1.4, “Tables” for details.
You can also focus on issues for certain code regions by defining an Issue Filter as described in Section 8.8.1, “ Definition of Filters, Modules and Root Directories ”.
