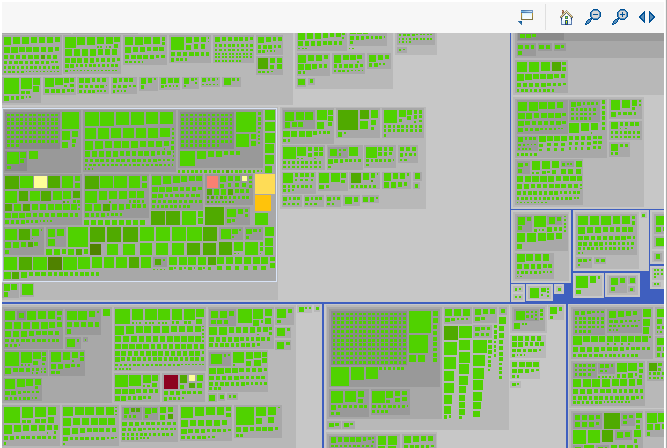
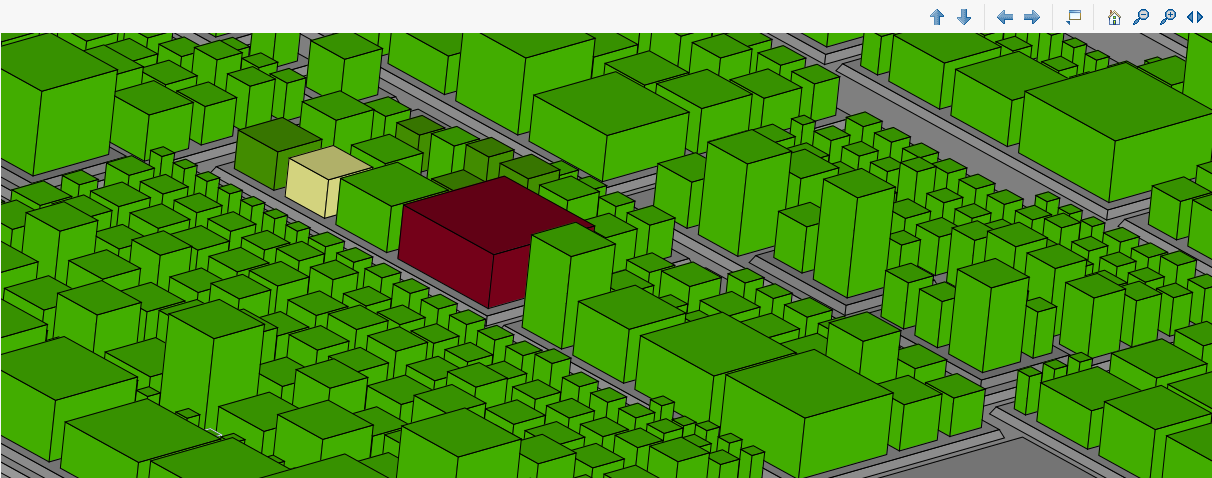
The Treemap View allows users to create a 2D / 3D representation of the system to find out where the hotspots are. See also Section 9.2.2, “ Identifying Issue Hotspots ”
Leaf elements are shown as squares. Their relative size is determined by the used size source. Their color is determined by the used color source. Optional: Their height is determined by the used height source. Parent elements show up as rectangles using grey color shades representing the nesting depth.
Configuration of a Treemap
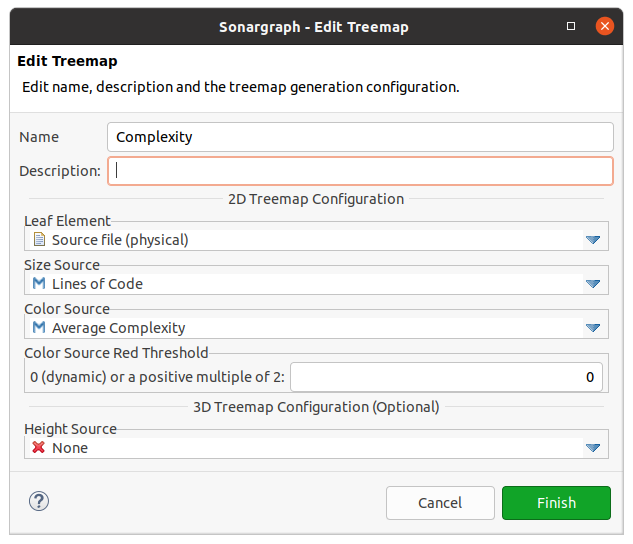
The generation of a treemap is controlled by the shown configuration options, which are stored in an XML file with
the specified name.
-
Select the elements to use as leafs.
-
Select the size source which determines the resulting relative size of the leaf elements.
-
Select the color source which determines the resulting color of the leaf elements.
-
Set the red threshold. If set to '0' an even mapping of values to green, yellow and red is dynamically calculated. When set to a value greater than '0', that value will be the first to be represented with a red color. The red threshold must be 0 or greater than 0 and a multiple of 2.
-
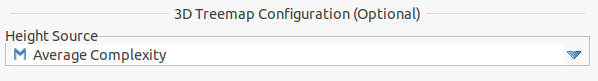
Optional (3D): Select the height source which determines the resulting height of the leaf elements.
In the generated treemap leaf elements will be shown as squares making it easier to spot the relative size differences. The color palette used for the leaf elements contains 3 green, 3 yellow and 3 red shades. For an 'ascending' color source (i.e. less is better) a darker color represents a higher number. For a 'descending' color source (i.e. higher is better) a darker color represents a lower number. Parent elements show up as rectangles using grey color shades representing the nesting depth.
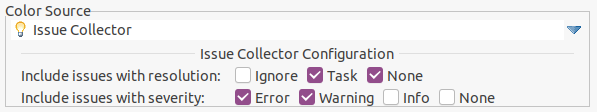
There is a special color or height source named Issue Collector, which counts the leaf element's number of issues. The issues to collect can be filtered by resolution and severity.
Interaction with Auxiliary Views
When the option 'Link Master Views' in the top level toolbar is enabled, selecting a square/rectangle will reveal the corresponding underlying element in the master view. The Properties view will show information about the corresponding underlying element of the selected square/rectangle.
Context Menu Interactions
The Treemap view offers the following context-menu interactions:
-
New Delete Refactoring: Create a new Delete Refactoring for the selected element.
-
New Move/Rename Refactoring: Create a new Move/Rename Refactoring for the selected element.
-
New Todo: Create a new Todo for the selected element.
-
Export Treemap View To Image: Export the Treemap as image.
Toolbar Interaction
The toolbar of the Treemap view contains interactions to change the size and view of the Treemap:
-
Auto Resize
 : When activated, sets the zoom level to fit the current window size.
-
Zoom in / Zoom out

 : Increases or decreases the zoom level.
-
Home
 : Sets the zoom level to 1.0. Resets any rotation (3D only).
-
Roll (3D only)

 : Rolls the treemap to the left or to the right.
-
Rotate vertically (3D only)

 : Rotates the Treemap up and down.
Mouse Interactions
Scroll wheel: Use the modifier key (CMD, CTRL) of your operating system in combination with the scroll wheel anywhere in a Treemap to zoom in or out at current mouse pointer position.
Left button drag: Drag the treemap around with left mouse button and SHIFT key pressed.
Hover: Hovering over a square/rectangle will open a tooltip showing additional information. That tooltip can be focused by clicking into it with a left mouse click.
