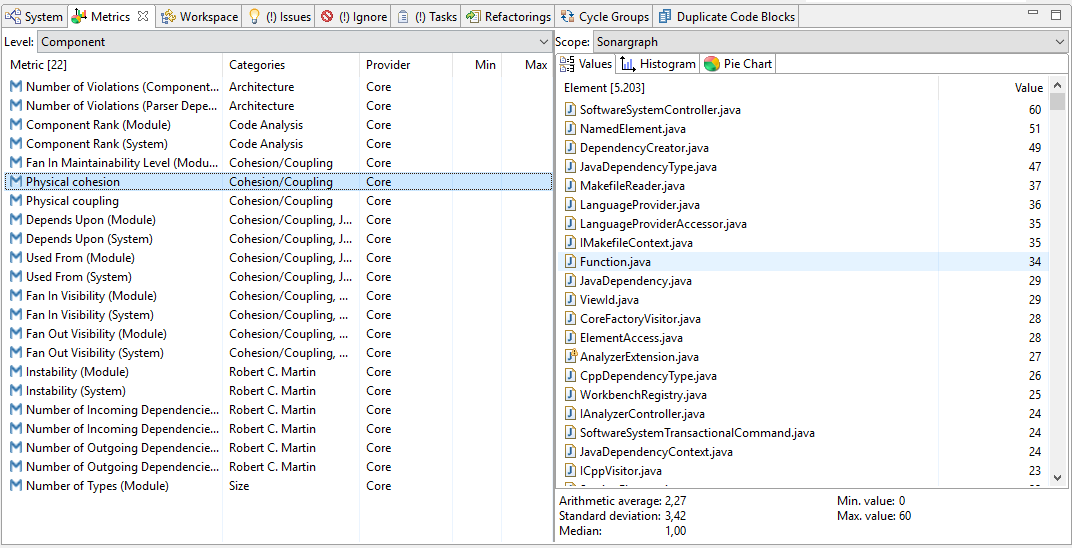
Sonargraph calculates metrics on different abstraction levels and displays them in the Metrics view. Metrics are calculated on different levels. Select the level in the combo box at the top left of the view and select the metric in the shown table. The list of metric values is then displayed in the first tab on the right. The scope (i.e. for the whole system or a single module) can be selected via the combo box at the top right of the view. The complete set of metric values can be exported via the context menu. Some basic statistics like average, standard deviation, median, minimum and maximum values are displayed below the list of values on the right.
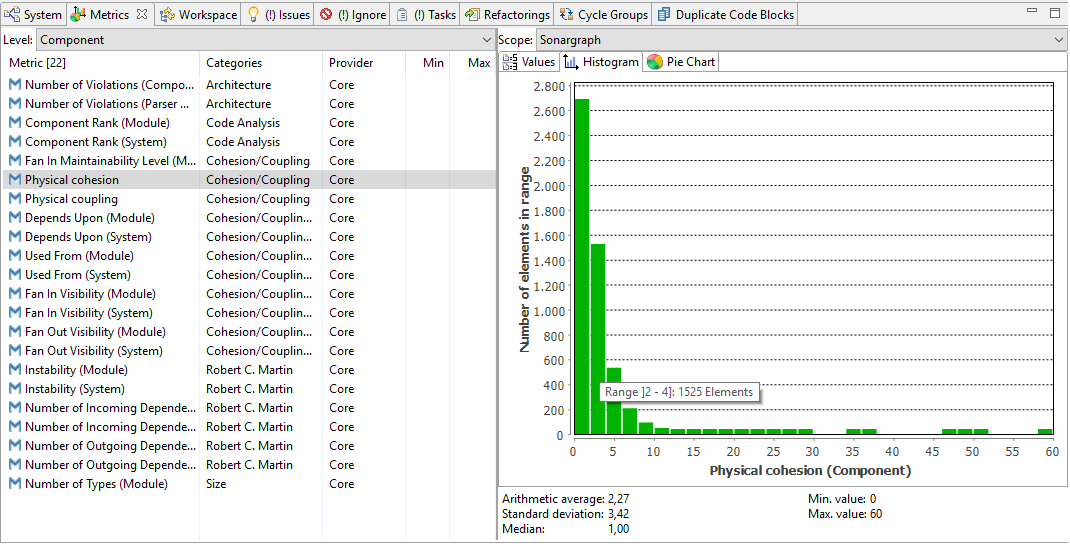
The histogram for the selected metric and scope is shown in the second tab on the right. The chart can be exported
as an image via the context menu.
The pie chart is only available for metrics with a defined threshold.
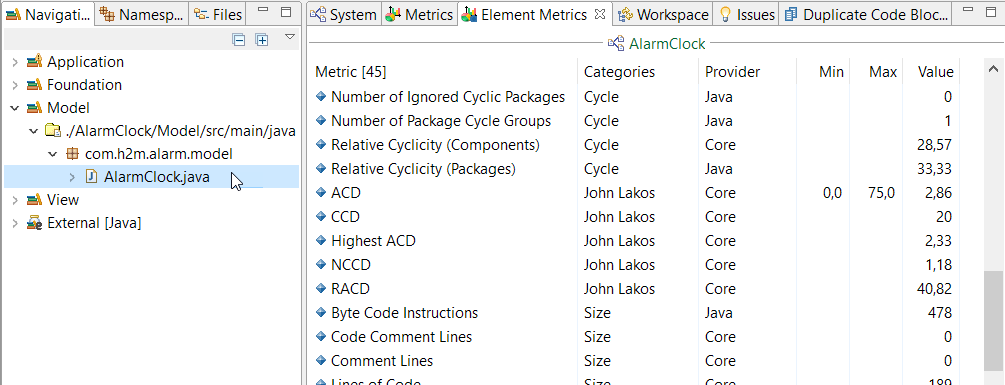
If you are interested in all metrics of a specific element, the Element Metrics view can be opened via the main menu → → .
The metric thresholds configuration allows to define threshold values for those predefined metrics in order to have an accurate control of the behavior of your code base as it evolves.
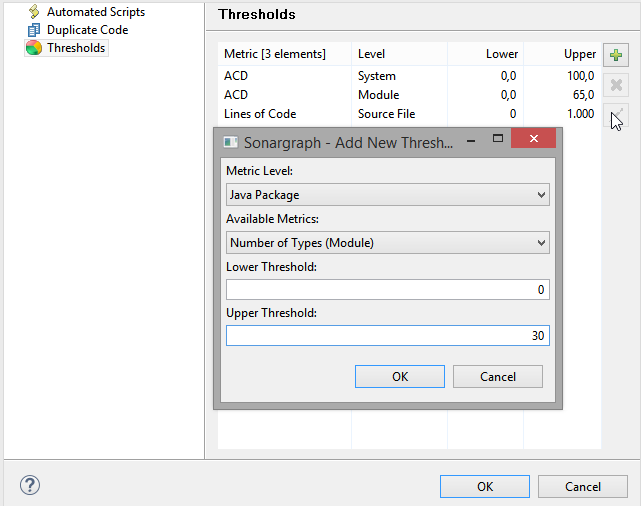
Thresholds can also be defined, edited or deleted via context menu by right clicking on a metric in the Metrics or Element Metrics view.
Related topics:
-
More information about the built-in metrics can be found in Chapter 21, Metric Definitions .
-
Custom metrics can be defined using Groovy Scripts. More information is contained in Chapter 16, Extending the Static Analysis .
