Select → to generate an HTML or XML report containing all metric values, issues and resolutions (TODO, Ignore, Fix). You can select the element level for which the metric values are exported.
The corresponding XML schema can be found in <sonargraph-inst>/report.
TIP
The XML output is normalized to minimize the size of the file. To get a more expressive report, set the log level for the ReportExtension to "debug" in <sonargraph-inst>/logback.xml.
NOTE
The report files can easily get several MBs big and take a few seconds to generate. Start with the default configuration first to check the size and then increase the number of levels and the number of values per metric.
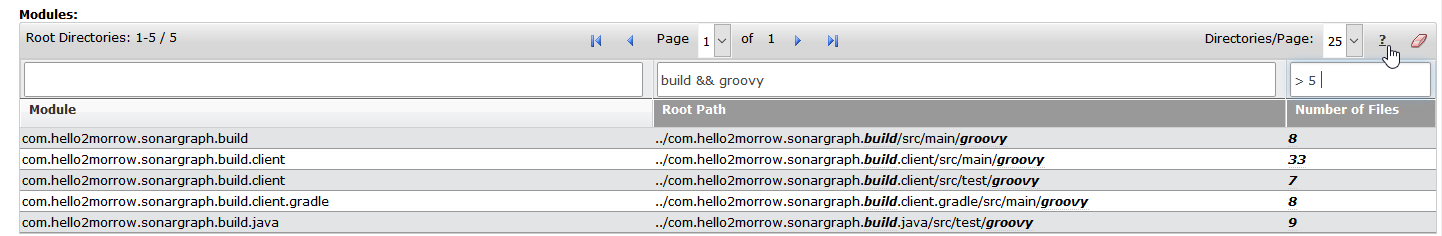
The HTML report contains tables that can be filtered, e.g. the table of "Unresolved Issues". The tables provide the following functionality:
-
The table header allows to filter for rows containing the specified text as shown in the screenshot. Paging will be enabled for tables containing more than 25 rows. You can select to show 25, 50 rows per page or all on one page by using the combo box on the right.
-
The table header provides info about the number of items shown and the current page.
-
The matching terms are highlighted as shown in the screenshot.
-
Several filter conditions can be connected via logical OR (||) and logical AND (&&).
-
Table cells containing numeric values can also be filtered for value ranges as shown in the screenshot.
-
Rows can be sorted by clicking on the table column header.
-
All filters can be cleared by clicking on the right-most icon.
-
A short help function is available by clicking on the question mark on the right.